
Google Analytics is a the go-to tool of nearly everyone who has a website. It’s free, it’s powerful, and it taps directly into Google’s powerful search. It provides truly actionable data that you can use to make decisions about your website’s marketing direction. Getting started with Google Analytics isn’t difficult, but you need to move past the entry-level approach to get the most out of it.

Understanding Some General Terms
Before you leap headfirst into Google Analytics, there are some basic ideas you should probably know first. They pop up in some of the reports we’ll cover next, and it’s helpful to know them so your reports make better sense.
- Pageviews: This is the number of times a visitor views a page. This counts every time a view occurs, including if the visitor refreshes a page or comes back to it later. It's a broad count of viewed pages and not individual visitors, and it helps you identify your most popular pages.
- Unique Pageviews: This is different than a pageview in that it combines the pageviews of the same visitor in the same session. So, if they visit a product page five times in the same session, it will only be counted as one visit.
- Sessions/Visits: This is a count of individual “sessions” that a visitor spends on your site. It doesn’t matter how many pages a visitor views or what they do. A session is considered "over" after about 30 minutes of inactivity or if the visitor leaves your site for more than 30 minutes before coming back.
- Hits: These are any interaction during a visit, including pageviews, events, and transactions.
- Entrances: These are registered as the first pageview of a session. There are scenarios when your entrances and your sessions don’t register the same count.
- Unique Visitors: This is a first-time visitor to your site, and is based on a Google Analytics cookie. Both a new and unique visitor count are added initially, and if the visitor returns again, the unique visitor count does not register. However, it can’t always be relied on as completely accurate (e.g. the cookie may be deleted). This is slightly different from new vs. returning visitors, which is based on a specified time period (and also dependant on a cookie).
- Bounce Rate: This measures (through a percentage) all of your single-page sessions. Understanding the reasons for a high bounce rate (which you don’t want) is important for taking actionable change based on your analytics data.
- Segments: Google Analytics allows you to create subsets of your data for your own specific needs. These help you better understand the trends in your business and can be based on subsets of users, sessions, and hits. You can use filters to further clarify your data.
- Events: These can be set up in your analytics account to help you track activity independent of page or screen loads. For example, you could track ad clicks, use of gadgets, or how many video plays a video on your site received.
- Goals: You can set up goals to measure specific actions your site’s visitor might take. These might include a visitor making a purchase, finishing a game, signing up for your email newsletter, or downloading an ebook. Setting up the right goals are key in knowing how successful you are at actually converting visitors to specific action and not just getting eyeballs on your website.
There are obviously many more terms to learn, but knowing these will help because you’ll see them pop up in a lot of the reports.
Understanding Traffic Data
Traffic is what most of you are interested in learning about, and Google Analytics provides a few different approaches to how and what you can measure.
Traffic Sources
Google Analytics can tell you how someone got to your website through traffic source dimensions, and use the following terms when referring to these measurements:
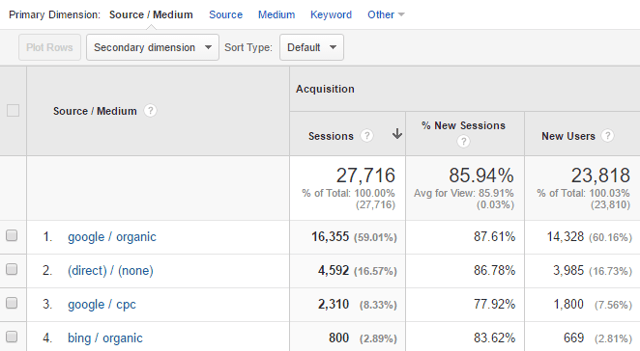
- Source: This is what referred a user to your site. It could be a search engine, another website, your email newsletter, or direct traffic.
- Medium: This is how the user ended up on your site. It could be organic search, paid search, referral, email, or “none” (i.e. direct).
- Campaign: If you’re using AdWords or some other custom campaign to drive traffic, you will be able to see if the visitor came through that route.
- Content: This allows you to see which specific link or piece of content sent a visitor to you. It's most often used in conjunction with a custom campaign.
- Keyword: Google Analytics doesn’t provide as much as they used to in regards to keyword data due to user privacy protections, and so seeing “Not Provided” (seen when users use SSL search, i.e. users logged in with their Google accounts) can be a huge pain. Keyword data is, after all, one of the main things most websites owners need to know so that they can adjust their content to better fit their audience. Still, there will be some keyword data available.
Different Types Of Search Traffic
Expanding a bit on the list above and focusing specifically on search traffic, it’s useful to know the difference between some key terms:
- Direct traffic vs. referral traffic. Direct traffic is when your visitor types the URL of your website directly into a browser. Sometimes, when Google can’t figure out the source of a visit, it will consider it direct traffic. Referral traffic is simply when a visitor arrives at your site from clicking on a link from someplace else. If you’re using Universal Analytics, you can exclude some of the domains that might otherwise appear in your referral sources.
- Organic traffic vs. paid traffic. Organic traffic means the visitor found your site by doing a search and clicking on a link that appeared in the results. Paid traffic, however, is when the visitor arrived at your site after clicking on one of your paid search engine advertisements.
Side note: generally, search engine robot traffic is not counted, so you shouldn’t have to worry about that.
Using Google Analytics Reports
Google Analytics makes it easy to create reports that bring some sense to what might otherwise be confusing data. There are a lot of different reports you can access, but some are probably a bit more useful than others.
You can access reports from the left sidebar of the “Reporting” screen on your analytics dashboard. These are arranged by Audience, Acquisition, Behavior, and Conversions, much like a sales funnel would be. Beneath each of these sections are a variety of specific reports related to the section but in a specific way. You should definitely take the time to explore each report (there are many!), but there are a few to pay specific attention to that touch on what are probably your core concerns:
- Who is my audience and what are they doing?
- How is my audience getting to my site?
- Is my social media marketing working?
- Is my website successfully converting?
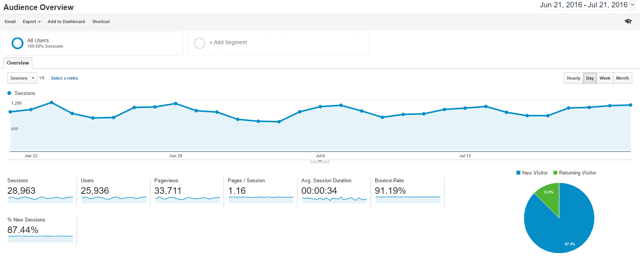
Audience Reports
Not to exaggerate, but there are a ton of reports you can get from the Audience section of Google Analytics. These are just some of the most useful ones.
- Mobile: Since we’re now in an age where Google penalizes websites for not being mobile friendly, you can’t skip these reports. Mobile reports let you see how well your site is doing on various devices. Check this regularly, especially after you’ve made website design changes.
- Users Flow: The Users Flow report helps you see, through visual interpretation of your data, the relative volume of your traffic based on a dimension (i.e. a filter) that you choose, the relative volume of pageviews of specific pages or collections of pages, and other specific metrics. This report is focused specifically on the pages your visitors go to and the route they take.
Traffic Reports
You can locate your traffic reports in Acquisition > All Traffic as well as Acquisition > Overview.
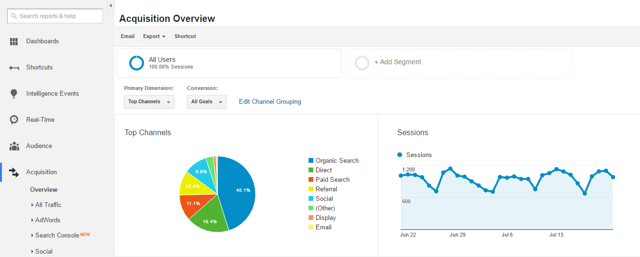
In this section, you can see some of the things we covered early, including traffic sources, and referrals.
- Treemaps: This strange-sounding report is a way to visually see data trends. This helps you form theories about your traffic because it shows different relationships in your traffic data.
- Referrals: Finding out who is sending traffic your way should prompt you to take an active approach; go to the sites and pages and see what context they are linking to your site. Take a look at the behavior of the visitors that come from that referral site. If you’ve done some guest posting, watch for related traffic so you know which efforts pay off. And keep an eye out for spammy sites so that you can exclude them from your referral traffic data.
- Channels: Google provides default channel groupings of your traffic (e.g. “paid search” or “direct”), but you can also create custom groupings to provide more valuable channel data. These might be based on things like landing page URL, traffic from specific partner sites, and so on. The default channels provide significant information, but you might need more customization depending on what you want to track.
Frankly, most Google Analytics users make the traffic reports their first (and sometimes, only) stop, hitting the “Overview” section and doing little else. Hopefully that’s not your approach, even though the traffic reports are some of the most important.
Social Reports
Social media is likely a key component of your website marketing plan. Google Analytics provides several social reports that make it easy to see how effective your social media actually is for your site. There have been some changes to the reports Google Analytics offers (they’ve deprecated the Data Hub Activity and Trackbacks reports, for example), but there’s still useful information to be had.
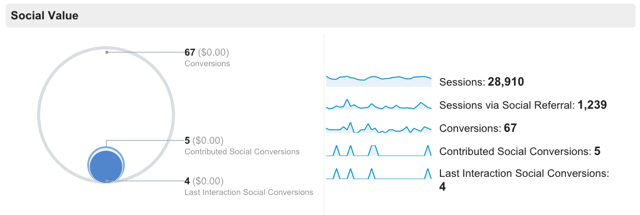
Find social reports in Acquisition > Social. From there, you can access:
- Overview: See how much conversion value you get from your different social channels, whether they are immediate conversions (“Last Interaction Social Conversions”) or later conversions (“Assisted Conversions”).
- Network Referrals: Find out which social networks bring in the best traffic. This isn’t just about hits, but traffic that is higher quality and tends to convert.
- Landing Pages: If you have landing pages, you can find out which social networks are bringing traffic to your specific pages.
- Conversions: This is probably one of the most important features, because it helps you see which social networks bring in traffic that actually converts, not just hits and bounces out. In order to make use of these reports, you’ll need to define your social goals.
- Plugins: Find out how visitors are using your Google +1 and Facebook Like buttons (if you have them on your site). In order to get any of these reports, you’ll need to do some setup first.
- Users Flow: You can follow the paths that your visitors took from social networks to get to your site. This is useful if you are running specific campaigns on social networks and want to see how effective they were to bringing people in and staying in your site.
Conversion Reports
Conversions are when website visitors take action. They buy, they sign up, they download -- they do the thing you want them to do, and sometimes they leave before they finish. Google Analytics can help determine what’s going on, but you’ll need to have set up goals for it to work.
- Reverse Goal Path: This rather underused report helps you see if your goal path is working as you expect. It provides the reverse path information. For example, you could use it to see if you blog posts are converting visitors into subscribers by knowing which blog post someone was reading before they signed up for your email. Keep in mind - it can only tell you about completed goals, not abandoned ones.
- Goal Flow: This report shows you the path of traffic as it went through a funnel towards a specific goal. It helps to show you if visitors are able to navigate through your site as you expected them to, or if there is a problem that needs to be changed (e.g. a call-to-action on a page that isn’t clear).
- Funnel Visualization: This report shows you, through visual data, the pages in a conversion process. For example, your online store would have a product page, a shopping cart page, a checkout page, and a thank-you page. With the funnel visualization, you can see if or where people dropped out of the funnel (which is not good). This report isn’t the same as Goal Flow, though it may seem similar.
Using Google Analytics Effectively
We’ve really only partially covered what Google Analytics can do. It’s a powerful tool! And, unfortunately, it can seem confusing. Too many businesses do the bare basic when it comes to using Google Analytics, and they get little more than hits and pageviews out of it. In order to turn it into a tool that's actually useful, be sure you:
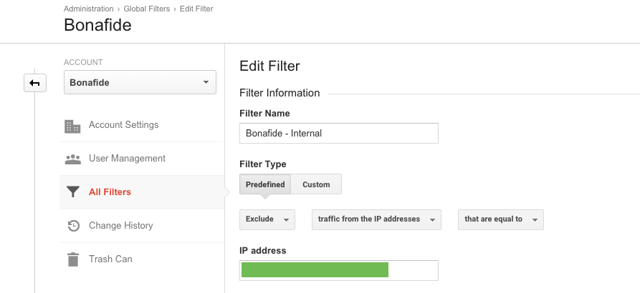
- Filter out your own traffic. You don’t want to be counting internal traffic to your website. Your after visitor and customer data, not measuring how many times your team visits your own site. Be sure to exclude internal traffic from your Google Analytics data.
- Set up conversion goals. There’s a bit of a learning curve to setting up useful goals in Google Analytics, but without them, you really aren’t learning anything extremely useful as far as conversions go. Learn how to set up goals on your own, or hire a Google Analytics expert to help you, but don’t skip this step. You can assign a dollar value to specific goals to provide you with value data.
- Set up UTM parameters on links. These are custom links you create that help you better understand the value of what’s happening on social media. Using Google’s URL builder will make it relatively easy, allowing you to set the source (social), the medium (specific social network), and your chosen unique campaign identifier. You can assign a dollar value to specific links as well.
- Create a standard measurement plan. You and your team ought to come up with a set of questions or a spreadsheet in which you routinely measure the same specific things. It’s no good if you pop into Google Analytics randomly just to look at some numbers. First, set up a regular interval to check the data (e.g. the beginning of every month). Then create specific things you want to monitor or measure. For example, you might create a list of questions that the data can answer that also translate easily into corrective action (see next section).

FAQs
- What are the most popular mobile platforms of my users? You might find out you need a mobile app.
- Which social networks are bringing the most traffic? The most visitors that actually convert? You might need to change how you approach your social media.
- Which pages get the most views? While you might not be seeing all the keywords that bring people in, you can see what types of content are most popular and that tells you a lot. You might need to revamp an old, traffic-magnet blog post to keep it fresh and relevant, staying on top of evergreen content. Perhaps you should do more promotion of those pages on social media, or turn them into an ebook or email training course. Maybe you should write more articles on related topics.
- Which pages are causing people to bounce out? Perhaps there’s a design flaw or bad copy that needs to be fixed. Maybe the keywords you’re using to bring people in don’t fit the content well.
- How much time are people spending on your site? If people are leaving too quickly, even after a few pageviews, you may need to overhaul your content and make it more useful and engaging.
- Are readers converting into subscribers? If they are, it’s likely they are finding your content helpful. If they aren’t, you may need to bump up the quality of what’s on your site and make it more useful.
Google Analytics is a powerful tool, but it is only as useful as the effort you put into understanding, customizing, and habitually using it.